What You Need To Know About Physical Gold Supply And Demand
Much of the confusion regarding the gold price has to do with gold’s dual nature, being both a currency and a commodity. This confusion is removed when you realize that in terms of supply and demand dynamics gold trades more like a currency than a commodity.
The major difference between gold and perishable commodities is their stock-to-flow ratios, measured by the above ground stock divided by annual production. Gold has a very high stock-to-flow ratio, while commodities like wheat have a low stock-to-flow ratio.
Thousands of years ago people started using gold as money, because gold is immutable, easily divisible, and scarce. Gold is the most marketable commodity. Its long tradition as store of value means extremely little gold has been wasted over history. The vast majority of all the gold ever mined is still with us. Consequently, annual mine production adds about 1.7% to the above ground stock of gold.
![Abobe_ground_gold_stock[1]](/images/blog/2022/03/abobe_ground_gold_stock[1].png)
At the time of writing the total above ground stock of gold is 205,000 tonnes and global mine output in 2021 accounted for 3,560 tonnes. The stock-to-flow ratio (STFR) is currently 58 (205,000 / 3,560). Gold’s high STFR and the fact that most above ground gold is held for monetary purposes is what makes it trade like a currency.
For a thorough understanding of gold’s price formation, let’s first have a look at supply and demand dynamics of a perishable commodity. Then we will discuss how this differs from the gold market.
Soft Commodity Supply and Demand Basics
Based on data from the World Agricultural Supply and Demand Estimates (WASDE), the STFR in the wheat market is 0.35 (278 million tonnes in stock divided by 776 million tonnes of production). A low STFR causes the price of wheat mainly to be determined by what is annually produced versus what is used up. Existing stocks can only smooth a surplus or deficit in the market—calculated as production minus consumption—to a certain extent.
Wheat stored in a warehouse starts to rot after several years, so a surplus can’t be entirely absorbed as stock: it must be sold, which lowers the price. Market deficits, in turn, can’t be fully drawn from stock supply, and thus increase the price. In addition, because wheat’s sole application is consumption, for which fixed quantities are needed, the price is set between what is produced versus consumed.
In the chart below you can see that since 1974 a surplus or deficit in the global wheat market was positively correlated to the direction of the wheat price for 85% of the time. Logically, a surplus caused the price to decline, and a deficit caused the price to increase. Note, the left-hand side axis in the chart is inverted to match it to the wheat price.
![World_wheat_market[1]](/images/blog/2022/03/world_wheat_market[1].png)
All wheat market participants rely on wheat supply and demand data and the market balance (surplus or deficit). Farmers look at the balance to decide how much wheat to grow next season. Speculators use it to estimate what the price will be in the future. Producers will consider replacing wheat for another commodity if the price rises, and so forth.
Gold Supply and Demand Dynamics
The gold market is very different. Because gold isn’t be used up and is primarily used as a store of value, the gold price isn’t set between what is produced and consumed.
Due to its high STFR, gold supply mainly consists of inventory. And because virtually everyone buys gold as a store of value, demand consists mainly of inventory as well. The gold market can be seen as all sorts of trades moving metal from one inventory to another (with or without metal being altered in shape, weight or purity). Or the gold stays in the same vault but changes ownership.
Additionally, gold’s use for monetary purposes doesn’t require fixed quantities. People don’t buy gold because they need, for example, five troy ounces to build a house. What they need is “whatever amount of gold” in exchange for how much value they like to invest at the prevailing price. The gold price can be too low or too high, but there can’t be a surplus or deficit. This is what makes gold trade more like a currency than a commodity.
Measuring distinct types of demand, which are simply fragments of total trading volume, can help us gauge the sentiment of specific groups of buyers. But it’s senseless to compare it to annual production. Some consultancy firms, though, do exactly that: publish a gold market balance.
How come the confusion in the gold market?
After the gold standard was abandoned in 1971, the U.S. tried to “demonetize” gold by pushing a narrative that gold is useless, in order to make the dollar to look stronger. Although most central banks held on to their gold, and thus didn’t demonetize it, some people in the West stopped viewing gold as a currency, but purely as a commodity.
In the 1980s, consultancy firms like Gold Fields Mineral Services (GFMS) began publishing reports about gold supply and demand. These reports later included a market balance, supposedly indicating if the price of gold would rise or fall. In other words, they present gold as if it is a perishable commodity that can be in surplus or deficit.
Millions of gold investors have been confused by these reports, thinking that the price of gold is determined by the difference between annual mine production versus newly fabricated products. The latter is what consultancy firms chiefly report as demand.
Let’s have a look at the latest GFMS Gold Survey that is publicly available on their website.
![GFMS_gold_market_balance[1]](/images/blog/2022/03/gfms_gold_market_balance[1].png)
The main items on the supply side of the GFMS market balance are mine output and scrap supply. On the demand side sales of newly fabricated jewelry, industrial parts, and retail bars and coins are recorded. Net central bank (official sector) purchases/sales, net ETF (ETP) purchases/sales, and net exchange inventory increases/decreases are also added to the balance. At the bottom we can see the overall “net balance,” suggesting the market is in a surplus or a deficit. However, not surprisingly, this net balance has no statistical relationship with the price of gold.
In the chart below I have plotted the yearly net balance figures (obtained from Refinitiv, which nowadays owns GFMS) versus the gold price.
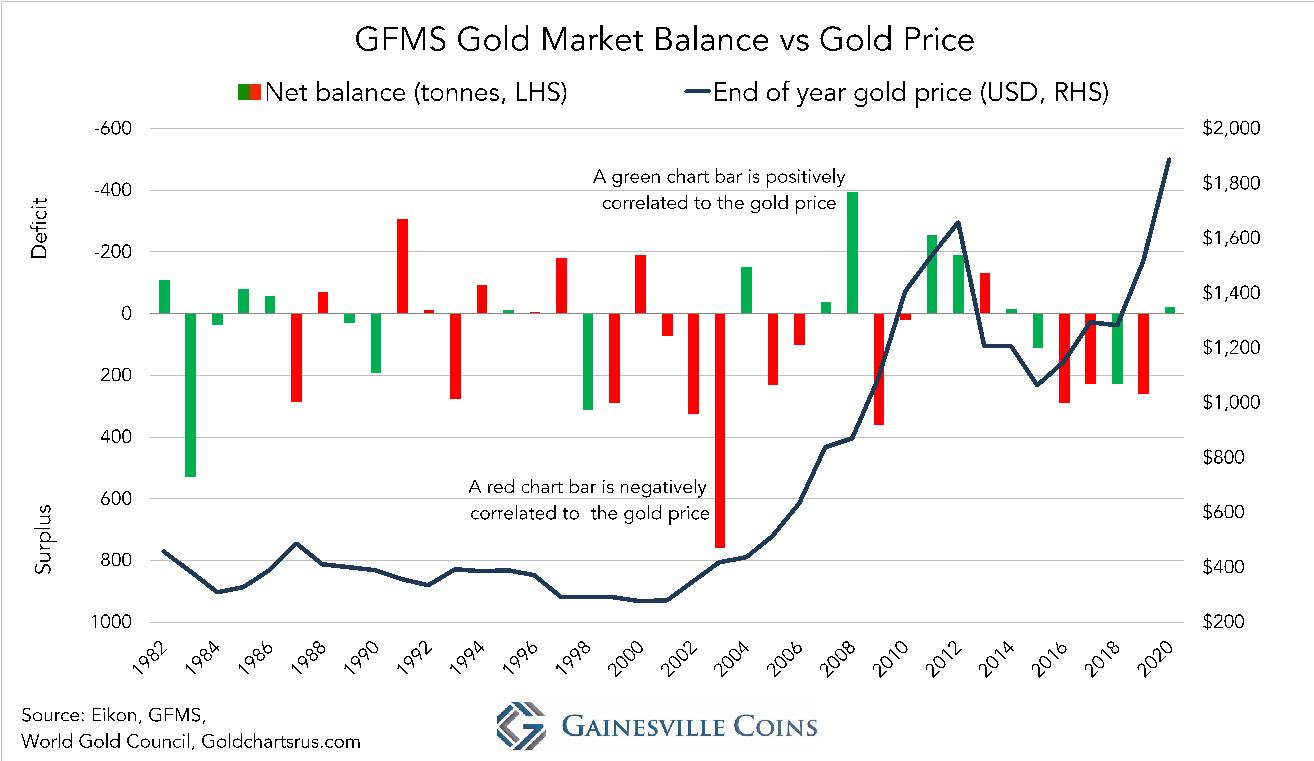
From 1982 until 2020 only 44% of the time a “surplus” or “deficit” in the gold market was positively correlated to the direction of the gold price. Flipping a coin would get a better result—50%. This disappointing score is explained* by the fact that gold is a currency and currencies can’t be in a surplus or deficit.
Moreover, according to GFMS the largest demand category is jewelry demand. Viewed in a chart, though, it shows that jewelry demand moves in the opposite direction of the gold price. Jewelry buyers are price sensitive; they do not drive the price.
![Gold_jewelry_demand[1]](/images/blog/2022/03/gold_jewelry_demand[1].png)
Because above ground stocks dwarf annual mine output, neither does mine production drive the price of gold in the short and medium term. Academic research confirms this statement. From Fergal O’Connor, Lecturer In Finance at Cork University Business School (source):
The [high stock to flow ratio] of gold implies low market power of gold mining firms and thus an inability to significantly influence gold prices. . . . [Mine] production thus follows gold prices.Gold miners have low market power and are likely to be price takers rather than price setters. . .
Annual mine output reacts to the gold price, not the other way around. When there is a bull market, new mining projects are initiated. Ten years later these mines start producing and elevate total mine output. Of course, in the long run mine supply does influence the gold price, as it increases the above ground stock over time.
![Annual_mine_output[1]](/images/blog/2022/03/annual_mine_output[1].png)
Institutional Supply and Demand Drives the Gold Price
If an investment fund buys an allocated 400-ounce gold bar from a bank in London, this trade doesn’t show up in supply and demand data published by GFMS. Yet, it has the exact same impact on the gold price as the sale of 400 newly minted coins weighing 1 troy ounce.
As 400-ounce bars are traded in massive volumes all day long in the London and Swiss wholesale bullion markets, that’s where the price is set. Fifteen out of the past seventeen years the net flow of gold (import minus export) through the UK has been positively correlated to the price of gold. That’s not a coincidence. Institutional supply and demand in above ground gold drives the price.
![UK_net_flow[1]](/images/blog/2022/03/uk_net_flow[1].png)
Derivates markets are connected to the London Bullion Market (the most liquid spot market) through arbitrage. The forces from the COMEX futures market in New York are executed on physical supply and demand in London.
The reason why net import and net export in London is often correlated to the gold price is because usually “the East” takes the other side of the trades in the West. If Western institutional investors buy gold, driving up the price, countries in Asia will sell and metal flows from the East into London vaults. When Western institutional investors sell gold, driving down the price, countries in Asia buy and metal flows from the UK toward the East.
An accurate gold supply and demand overview would cover global physical gold trading volume, but it wouldn’t include a net balance. After all, for every buyer there is a seller. There can't be a surplus or deficit as with soft commodities. That is not to say that all GFMS data is meaningless; much valuable information can be extracted from it. My main objection is their “market balance” approach.
*The fact the net balance is often negatively correlated to the gold price is because GMFS's largest demand category is jewelry demand. As discussed, jewelry buyers are price sensitive, so when the price goes up jewelry demand goes down, and the net balance flips to a surplus.
Read more about how the gold market works with this expert information from Gainesville Coins:
Why Gold Coin Demand Doesn't Drive the Gold Price
France Has Repatriated All Its Monetary Gold
Investing in Gold for Beginners
The Best Place to Buy Gold: Key Factors and Options
How to Sell Gold: Step-by-Step Guide
6 Gold Buying Mistakes to Avoid
How to Buy Gold Bars: Buyer's Guide
Spot Price: Definition and Practical Uses