Gold Price History: Why Did Gold Fall In 2008?
The gold price averaged $872 per troy ounce in 2008, but that's hardly the whole story. There's much to learn from the volatile movement of gold prices in 2008.
With the economy now facing the possibility of a deep recession, memories of the last global financial crisis have resurfaced. 2020 has already been a wild ride for the gold market. What can we expect this time?
Historical analogies to Great Depression don't serve us well in this case. Back then, a gold standard was still in place. Thus gold prices rose only because the government devalued the U.S. dollar—after essentially confiscating all of the country's gold.
2008 is the most recent point of comparison to determine what happens to gold in a recession. Let's take a look at what we already know.
Why Did Gold Fall In 2008?
Much of the world's banking and financial system buckled in the autumn of 2008. It was the worst economic downturn since the Great Depression began in 1929. With the benefit of hindsight, we know that the American economy actually entered a recession in late 2007.
Gold prices rallied for much of this intervening period. The spot price averaged nearly $700 per troy ounce in 2007, posting an annualized gain of over 30%. This was right in the midst of a decade-long bull run for gold that began in 2001.
The trend continued at a blistering pace to start 2008. Through the first quarter, gold surged to new nominal all-time highs (at the time), breaking the $1,000 per oz mark for the first time ever.
Then something surprising happened. From March 12 and March 13, 2008 to October 2008, as the magnitude of the unfolding crisis was becoming clearer, the gold bullion market experienced an increasingly disorderly selloff. (In the interim, on March 14, 2008, investment banking firm Bear Stearns was bailed out and later sold to JPMorgan Chase.) Prices fell to their lowest value for the year, $692.50/oz, in the wake of the Lehman Brothers collapse on September 15, 2008. All told, the gold price declined by roughly one-third from peak to trough.
Gold Price Chart: 2007–2011 (log scale)

Average Annual Gold Prices: 2007–2011
| Year | Closing Price (average) | Price Change (YOY) | Annual High | Annual Low |
|---|---|---|---|---|
| 2007 | +31.6% | |||
| 2008 | +3.4% | |||
| 2009 | +27.6% | |||
| 2010 | +27.7% | |||
| 2011 | +11.7% |
*The price data above is based on the New York daily gold price gathered from the 100 year historical chart at MacroTrends.
Gold's downturn in 2008 turned out to be a bump in the road on the way to nearly $1,900/oz three years later. But why did gold fall so much in the first place? Isn't it a safe haven in times of market stress?
At the height of a selling panic like we saw in the financial crisis, everything that's not bolted to the floor tends to get liquidated. That means liquid assets such as gold are often among the first things that get sold. As a result, for several months, even the precious metals followed the stock market lower.
History Is Repeating Itself In 2020
We've seen similar dynamics for the gold market this time around.
During the worst part of the Wall St selloff in mid-March, gold futures endured their two largest single-day losses ever, in back-to-back sessions. Gold even traded below $1,500 per ounce briefly. Prices did recover to about $1,650/oz by the end of the month, but by then it had become difficult to find physical metal (gold coins) without paying a huge premium, anyway.
Volatility remains high. The swings for markets have been larger and faster than they were even in 2008. Given the uncertainty of the coronavirus, this may be the case for many months still. In the last four months of 2008, the VIX (CBOE's volatility index) stayed elevated above 45.
Overall, however, the pattern that's repeating is once again in gold's favor. The precious metals have traditionally performed well as safe havens following a crisis. Note that the highest price of gold in history was notched in 2011 rather than 2008 or even 2009. The same was true for silver prices.
The lesson is that the safe-haven response can take years to fully play out—particularly if the world is mired in a protracted bear market and the Fed keeps interest rates near zero.
When we look at the gold price history over the last 10 years or so, a few things stick out.
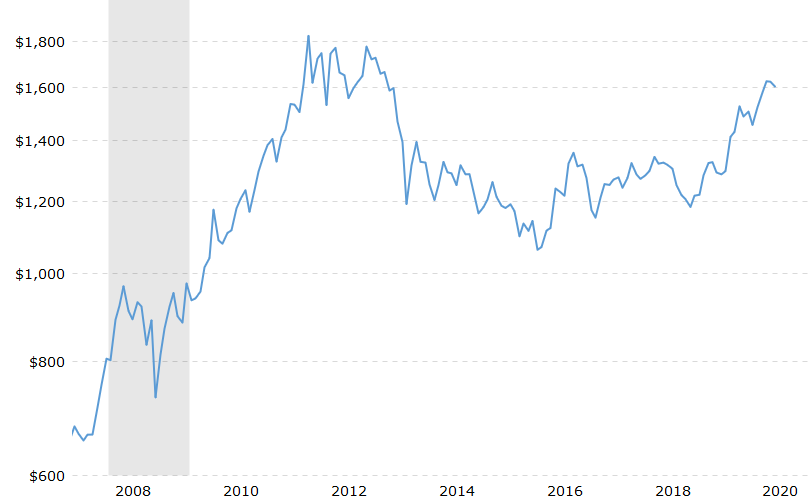
Gold Price Chart: 2008–2020 (log scale)
Average Annual Gold Prices: 2012–2020
| Year | Closing Price (average) | Price Change (YOY) | Annual High | Annual Low |
|---|---|---|---|---|
| 2012 | +5.7% | |||
| 2013 | (27.8%) | |||
| 2014 | (0.2%) | |||
| 2015 | (11.6%) | |||
| 2016 | +8.6% | |||
| 2017 | +12.6% | |||
| 2018 | (1.2%) | |||
| 2019 | +18.8% | |||
| 2020* | +12.8% |
*Through April 2020
Gold experienced a bear market for roughly six years, beginning in 2012. Aside from a few brief spikes to around $1,350/oz, the trend was clearly downward and then sideways.
Late 2018 marked a turning point. Prices have since climbed more than 33% to above $1,600/oz.
Timing the absolute top or bottom of any market is a near-impossible fool's errand. But we can identify broader trends and cyclicality to draw some conclusions about gold's likely future performance.
Here are my three major takeaways from analyzing the behavior of gold prices in 2008:
1. Gold traded in a wider range than normal.
In other words, volatility was elevated, which is once again true today. Although gold saw a few big swings, it closed the year marginally higher than where it started.
If we want to understand what the gold price will be in 2020, it's appropriate to express that as a range. I expect gold to range from $1,400 to $1,750 per troy ounce in 2020.
Rather than guessing the exact price—as if it's a bunch of jellybeans in a jar—we can use the target range as our guide. This is a much more conservative approach, but it will make our analysis more robust by accounting for short-term volatility.
2. Gold rallied leading up to the crisis.
Gold ended the calendar year in the green each year from 2001 to 2007, as measured in virtually every major currency.
Just like in 2008 financial crisis, the gold price was already climbing higher well prior to 2020. Prices have risen four of the last five years. The only exception was 2018, when gold prices essentially broke even in U.S. dollar terms.
Believe it or not, from 2016 to 2019, gold was up nearly 44%. You might wonder why you didn't hear much about it until now!
3. Gold sold off several times before a sustained bull run.
The surge in prices over the past 12 months has set the stage for a consolidation phase. These big moves to the upside are generally followed by a period of prices churning sideways, at times even drifting lower, as bullion market participants digest new information.
This suggests that gold may still test the bottom of that channel sometime this year. $1,475 is as low as we've seen so far in 2020, but recall from the historical charts above that $1,400/oz was an extremely durable resistance level as recently as June 2019. Until last summer, the gold price hadn't poked its head above $1,360/oz since 2013.
Is Now a Good Time to Buy Gold or Sell Gold?
Whether or not gold prices fall in the near-term will depend primarily on market sentiment. The Federal Reserve and other central banks are expected to play a major role, as will the London Bullion Market Association (LBMA). Traders will closely watch the ratio of gold to the dollar price index known as the DXY.
As I said earlier, trying to guess the exact price or timing is an impossible feat. Ideally, precious metals are held for long-term wealth preservation rather than short-term profits, as suggested by the IMF and World Gold Council.

So deciding if it's the right time to buy gold or the right time to sell gold is a matter of your personal circumstance: How much exposure your portfolio already has to gold and whether you need to free up some cash are each factors to consider, regardless of where gold prices today happen to be.
Buy Gold
Sell Gold and Silver

Everett Millman
Everett has been the head content writer and market analyst at Gainesville Coins since 2013. He has a background in History and is deeply interested in how gold and silver have historically fit into the financial system.
In addition to blogging, Everett's work has been featured in Reuters, CNN Business, Bloomberg Radio, TD Ameritrade Network, CoinWeek, and has been referenced by the Washington Post.